OpenTelemetry and Istio: Everything you need to know
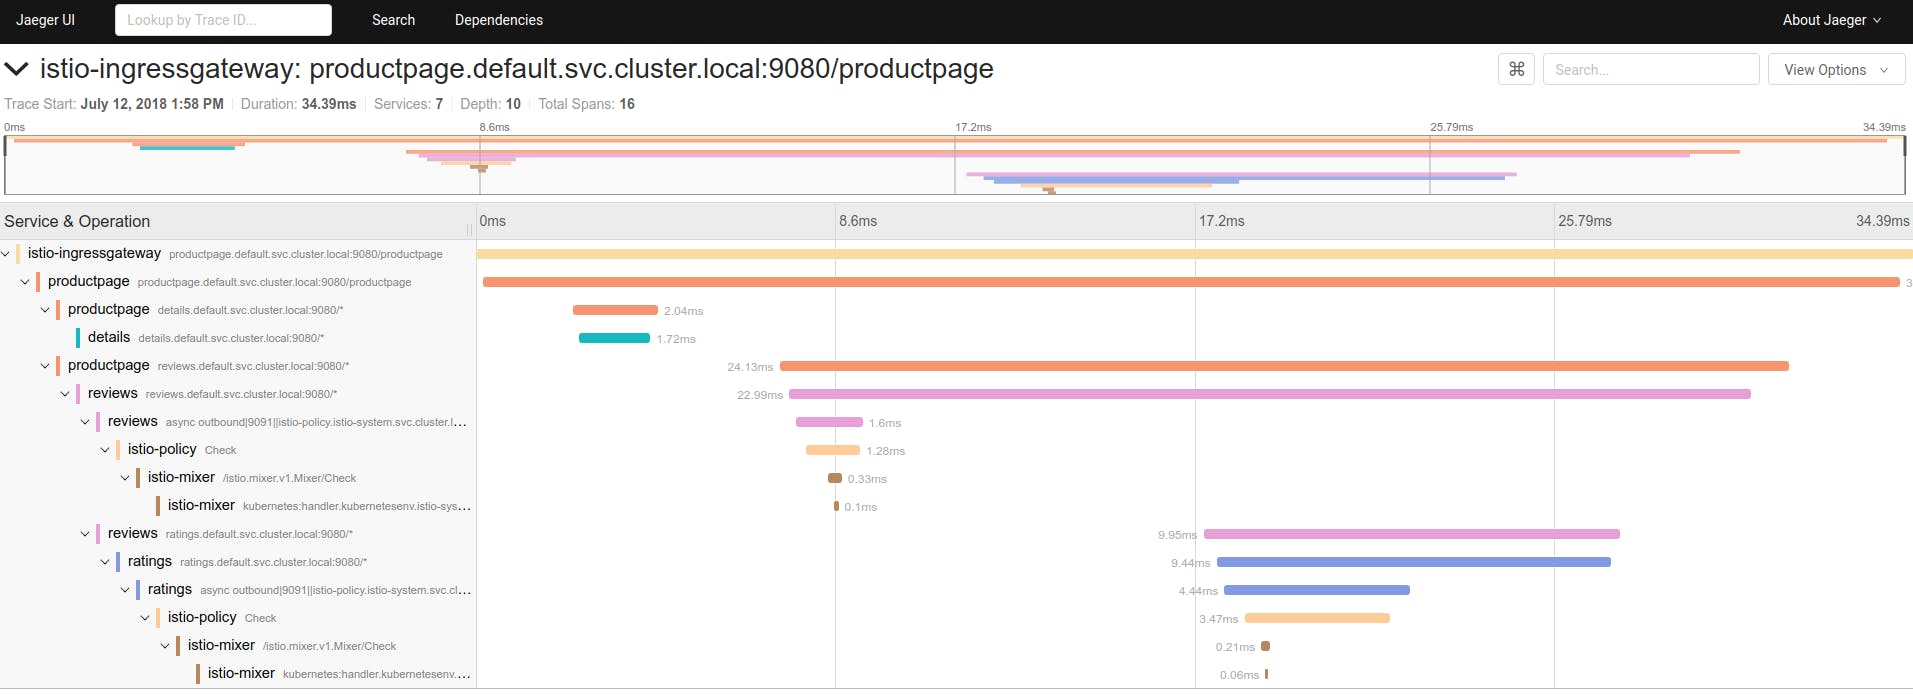
In this article, you will learn about the good, the bad, and the ugly of using Istio to collect traces.
There is a high correlation between R&D teams using Istio (k8s) and OpenTelemetry.
The reason is that OpenTelemetry shines when there are a lot of services communicating with each other and the best platform to host it is k8s.
Getting started with OpenTelemetry can be a challenge as it requires a lot of knowledge. Having a high entry point effort, it seems like a good idea to set up Istio to produce distributed traces because the setup is relatively fast and simple.
In this article, you will learn about the good, the bad, and the ugly of using Istio to collect traces. By the end, you will be able to decide whether using Istio is right for you.
OpenTelemetry and Istio: The Good
- Easy to set up.
- No code level changes are required.
Because Istio is responsible for managing traffic, it can also report logs, metrics, and traces that allow visibility to Istio and the application behavior.
Istio knows where each API call was originated from and where it is heading, making it easy to build inter-service communication (this comes with a caveat. More on that below).

The setup is quite easy:
--set tracing.enabled=true
Now, just point it to the right destination to enable tracing and you are good to go:
`--set values.global.tracer.Zipkin.address=<jaeger-collector-address>:9411`
This is easy compared to the other options for collecting trace data where you need to implement an SDK within your application code.
Implementing an SDK in our code is a far more complex and demeaning assignment (though it allows us to collect more data and provide more flexibility).
OpenTelemetry and Istio: The Bad
- Single “hop” between services (“hop” explained below)
- Only allows service to service communication (No databases, messaging systems, etc.)
- Sampling is an issue.
Single “hop” between services
Since there is no code running within the application to collect data, you can collect partial data with partial context.
Take a look at the diagram below. When service A calls service B, Istio creates a span that represents this event. However, when service B calls service C, Istio cannot recognize that it’s the same continual trace originating from service A.
It creates a new trace (which is what I meant by using the term “hop”).

To solve this issue, you need to install OpenTelemetry SDK in each service to extract the context propagation from Istio and inject it into the downstream services.
Meaning, you probably have to install OpenTelemetry to get proper traces.
(Note that OpenTelemetry uses, by default, the W3C context propagation specification, while Istio uses the B3 context propagation specification – this can be modified).
Service to service communication
When visualizing traces with Istio, you only see HTTP and gRPC communication. Databases, cache, messaging systems are not visible.
Sampling
We use traces to debug issues in production when we cannot solve them with more traditional methods like logs and metrics. These are the cases where you need more granular data, and any piece of information is crucial.
Setting up Istio to collect traces is easy, but it may not solve the problem you set out to solve.
100% of the organizations I met that collect traces do not collect 100% of traffic. Each and every one of them uses sampling.
Sampling is a complex issue by itself, and you need lots of tools to address it. Unfortunately, Istio only gives you the ability to set the percentage of the traffic to collect. Features like different percentiles for different HTTP routes are not supported.
Here, again, OpenTelemetry comes in handy.
To allow yourself to make a better decision, you might want to dig deeper into sampling with OpenTelemetry. Here is an article that covers everything you should know about sampling.
OpenTelemetry and Istio: The Ugly
- Istio supports Jaeger and Zipkin format, but both are sunsetting for OpenTelemetry to rise.
Most organizations today choose to use OTel to collect traces. This is because Jaeger (at least the collecting / SDK clients parts) is in sunset mode. The official project you should use is OpenTelemetry.
If you choose to run both Istio and OpenTelemetry, as mentioned above, make sure to configure OpenTelemetry to use B3 or write dedicated code that transforms B3 to W3C (unless you’re into broken traces. You do you, we don’t judge).
In any case, this is quite ugly (which makes sense since this is the ugly part of this article).
I assume it is just a point time, and Istio will be able to produce traces with the correct context propagation.
Btw, if at this point you feel like OpenTelemetry is for you and want to look into its different deployment strategies, here is a super quick guide for you.
Get Started with OpenTelemetry
Almost all organizations I know did try Istio’s distributed traces. However, within a short time, they either added OpenTelemetry or removed Istio for using only OpenTelemetry implemented within the code.
Running both is possible but requires some configuration. It also increases the amount of data being collected – meaning a single HTTP request has spans from both Istio and OpenTelemetry SDK.
Try it for yourself, and see what works best for you.
P.S. If you want to learn more about OpenTelemetry, you can check out this free, 6 episodes, OpenTelemetry Bootcamp (vendor-neutral).
It’s basically your OpenTelemetry playbook where you will learn everything, from the very basics to scaling and deploying to production:
Episode 1: OpenTelemetry Fundamentals Episode 2: Integrate Your Code (logs, metrics, and traces) Episode 3: Deploy to Production + Collector Episode 4: Sampling and Dealing with High Volumes Episode 5: Custom Instrumentation Episode 6: Testing with OpenTelemetry

