

In this OpenTelemetry dotnet guide, you will learn exactly how to set up a .Net project that leverages OpenTelemetry, from scratch, and without any prior knowledge of OpenTelemetry.
We will build a simple to-do app that uses ASP.NET CORE and MongoDB. We will then use OpenTelemetry to generate spans, and send them to Aspecto for visualization.
You can view the complete code on GitHub here.
OpenTelemetry Overview
If you're somewhat new to OpenTelemetry, here are the basics you need to know (you can also visit our OpenTelemetry Bootcamp if you want to become an OTel ninja).
OpenTelemetry is a suite of APIs and SDKs that facilitate the collection, export, and generation of trace data, log data, and metrics (also known as the three pillars of observability). Led by the Cloud Native Computing Foundation (CNCF, the organization responsible for Kubernetes), we utilize OpenTelemetry to gather data from events and operations occurring within our system, enabling us to instrument our distributed services.
This data is ultimately helpful in understanding and analyzing the behavior of our software, as well as troubleshooting any performance issues or errors.
OpenTelemetry serves as a single library that captures all data under a single specification and transports it to a designated location (e.g., backend, collector, or open-source supporting tools). In this OpenTelemetry dotnet guide, there are a few key terms to understand:
Span: A span represents an action or operation that occurs within our system. This can include an HTTP request or a database operation that takes place over a specific duration of time. Spans often have a parent-child relationship with other spans.
Trace: Traces are essentially "call stacks" for distributed services, representing a tree of spans connected in a parent-child relationship. Traces outline the progression of requests across various services and components in our application (such as databases, data sources, queues, etc.). For example, sending an API call to the user service may result in a database query to the users database.
Exporter: Once we create a span, we need to send it to a designated backend. This may be in memory, Jaeger Tracing, or even output to the console. The exporter handles the process of sending the data to the backend.
Instrumentation: Instrumentation libraries allow us to gather data and generate spans based on the libraries used in our applications, such as Kafka, Mongo, AspNetCore, etc. There are two approaches to instrumenting our application:
Auto instrumentation: Automatically creating spans from the libraries used in our application with the aid of ready-to-use OpenTelemetry libraries.
Manual instrumentation: Manually adding code to our application to define the beginning and end of each span and the payload.
For a more comprehensive understanding of OpenTelemetry terminology, visit the official documentation.
OpenTelemetry Dotnet: Building Our Project
Setting up .Net app
As mentioned, we are going to build a to-do app that uses ASP.NET CORE and MongoDB.
Here's how it's done:
1. Start by setting up a new web API project by running the following command:
dotnet new webapi -o OpenTelemetryExample
2. We will create a simple to-do list application using MongoDB in this example. So let's install the Mongodb driver for dotnet.
dotnet add package MongoDB.Driver
3. Create our to-do model. Create a file named Todo.cs in a directory called Models. Our model will have an id and a description. So our code should look like this:
using MongoDB.Bson;
using MongoDB.Bson.Serialization.Attributes;

namespace OpenTelemetryExample.Models;

public class Todo
{
  [BsonElement("_id")]
  [BsonId]
  [BsonRepresentation(BsonType.ObjectId)]
  public string Id { get; set; } = null!;

  [BsonElement("title")]
  public string Title { get; set; } = null!;
}
4. Add our controller to the Controllers folder. Our controller will expose three endpoints:
POST /todo -- To create a new todo item
GET /todo -- To get all todos
GET/todo/:Id -- To get a specific todo item
Our controller should look like this:
using Microsoft.AspNetCore.Mvc;
using MongoDB.Driver;
using OpenTelemetryExample.Models;

namespace OpenTelemetryExample.Controllers;

[ApiController]
[Route("[controller]")]
public class TodoController : ControllerBase
{
  private readonly IMongoCollection<Todo> _todos;
  private readonly ILogger<TodoController> _logger;

  public TodoController(ILogger<TodoController> logger, IMongoDatabase database)
  {
      _logger = logger;
      _todos = database.GetCollection<Todo>("todos");
  }

  [HttpPost]
  public async Task<ActionResult<Todo>> PostTodo([FromBody] Todo todo)
  {
      await _todos.InsertOneAsync(todo);
      return CreatedAtAction(nameof(GetTodos), todo);
  }

  [HttpGet]
  public async Task<ActionResult<IEnumerable<Todo>>> GetTodos()
  {
      var todos = await _todos.Find(m => true).ToListAsync();
      return Ok(todos);
  }

  [HttpGet("{id}")]
  public async Task<ActionResult<Todo>> GetTodoById(string id)
  {
      var todo = await _todos.Find(todo => todo.Id == id).FirstAsync();
      return Ok(todo);
  }
}
5. Register the Mongodb client in the dependency injection. Go to the program.cs file in the root directory:
In the main method, we will add the following code to init Mongodb (we will run mongo on running on your local machine on port 27017)
var mongoUrl = MongoUrl.Create("mongodb://localhost:27017");
var clientSettings = MongoClientSettings.FromUrl(mongoUrl);
var mongoClient = new MongoClient(clientSettings);
6. Then, register it as a singleton.
builder.Services.AddSingleton(mongoClient.GetDatabase("todo"));
7. Now we can run our dotnet project with the command
dotnet run
8. And create a todo with a post request to /todo and view it by making a get request to /todo.
Adding OpenTelemetry and visualizing our Dotnet traces
You are now familiar with the fundamental concepts of spans, traces, instrumentations, and generally how OpenTelemetry can be utilized to generate traces for Dotnet applications. Let's add OpenTelemetry to our project and send spans for visualization with Aspecto.
Using Aspecto to visualize data is incredibly straightforward. If you wish to explore Aspecto for yourself, you can try the free-forever plan which offers unlimited features including unlimited workspaces, user invites, sampling rules, and more.
Consider playing with the Live Playground to gain a deeper understanding.
Here's how you do it:
1. Install the following dependencies:
dotnet add package OpenTelemetry.Exporter.OpenTelemetryProtocol
dotnet add package OpenTelemetry.Extensions.Hosting --prerelease
dotnet add package OpenTelemetry.Instrumentation.AspNetCore --prerelease
dotnet add package OpenTelemetry.Instrumentation.Http --prerelease
Dotnet add package MongoDB.Driver.Core.Extensions.DiagnosticSources
dotnet add package MongoDB.Driver.Core.Extensions.OpenTelemetry
We will be exporting spans to Aspecto using this package we just installed.
dotnet add package OpenTelemetry.Exporter.OpenTelemetryProtocol
2. Configure OpenTelemetry by going to the program.cs file and add the following code to the main method. Make sure to add your aspecto token to your ASPECTO_API_KEY environment variable (get it here)
        var serviceName = "your-service-name";
        var serviceVersion = "your-service-version";
builder.Services.AddOpenTelemetryTracing(tracerProviderBuilder =>
            tracerProviderBuilder
                .AddOtlpExporter(opt =>
                {
                    opt.Endpoint = new Uri("https://collector.aspecto.io:4317/v1/traces");
                    opt.Headers = $"Authorization={Environment.GetEnvironmentVariable("ASPECTO_API_KEY")}";
                })
                .AddSource(serviceName)
                .SetResourceBuilder(
                    ResourceBuilder.CreateDefault()
                        .AddService(serviceName: serviceName, serviceVersion: serviceVersion))
                .AddHttpClientInstrumentation()
                .AddAspNetCoreInstrumentation()
                .AddMongoDBInstrumentation()
        );
💡Good to know -- If you wish to export traces to Jaeger, you should use the AddJaegerExporter instead of the AddOtlpExporter. Visit the opentelemetry-dotnet repository to see how it's done.
3. Next, add this code to register the mongo db instrumentation:
clientSettings.ClusterConfigurator = cb => cb.Subscribe(new DiagnosticsActivityEventSubscriber());
4. The complete program.cs file should look like this:
using MongoDB.Driver;
using MongoDB.Driver.Core.Extensions.DiagnosticSources;
using OpenTelemetry.Trace;
using OpenTelemetry.Resources;

internal class Program
{
    private static void Main(string[] args)
    {
        var builder = WebApplication.CreateBuilder(args);

        //Mongodb instrumentation config
        var mongoUrl = MongoUrl.Create("mongodb://localhost:27017");
        var clientSettings = MongoClientSettings.FromUrl(mongoUrl);
        clientSettings.ClusterConfigurator = cb => cb.Subscribe(new DiagnosticsActivityEventSubscriber());
        var mongoClient = new MongoClient(clientSettings);

        //OTel config
        var serviceName = "todo-dotnet";
        var serviceVersion = "1.0.0";
        builder.Services.AddOpenTelemetryTracing(tracerProviderBuilder =>
            tracerProviderBuilder
                .AddOtlpExporter(opt =>
                {
                    opt.Endpoint = new Uri("https://collector.aspecto.io:4317/v1/traces");
                    opt.Headers = $"Authorization={Environment.GetEnvironmentVariable("ASPECTO_API_KEY")}";
                })
                .AddSource(serviceName)
                .SetResourceBuilder(
                    ResourceBuilder.CreateDefault()
                        .AddService(serviceName: serviceName, serviceVersion: serviceVersion))
                .AddHttpClientInstrumentation()
                .AddAspNetCoreInstrumentation()
                .AddMongoDBInstrumentation()
        );

        //dependency injection config
        builder.Services.AddControllers();
        builder.Services.AddSingleton(mongoClient.GetDatabase("todo"));
        var app = builder.Build();
        app.MapControllers();
        app.Run();
    }
}
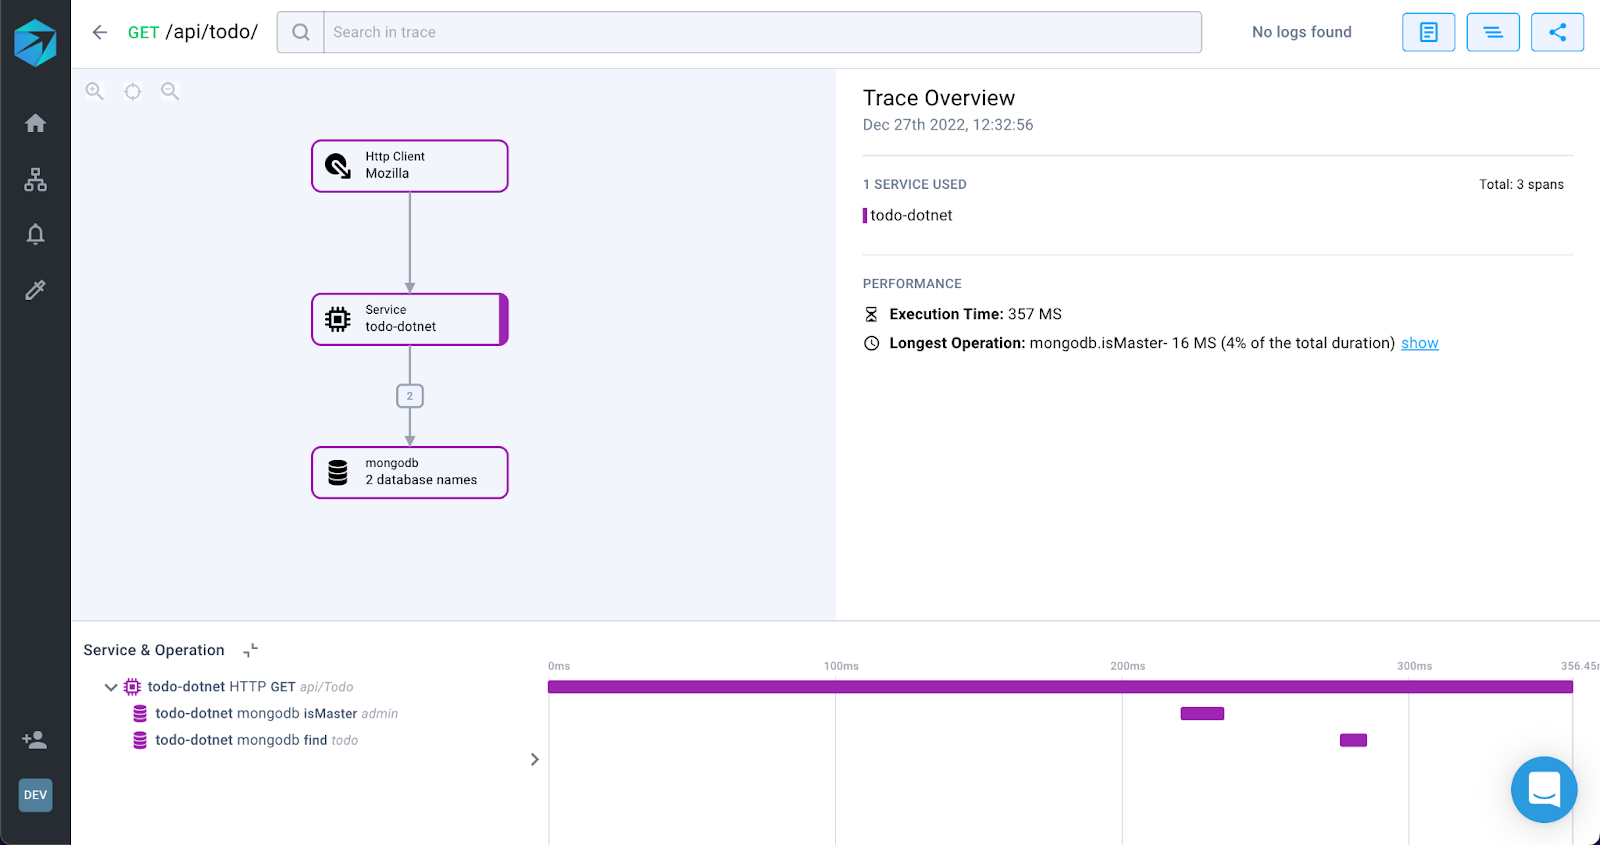
Now you should be able to run your application and view the traces in Aspecto.
Run Mongo locally. You can do it with docker.
docker run -p 27017:27017 --name mongo -d mongo:latest
The end result should look something like this:
Advanced OpenTelemetry Learning
If you want to learn more about OpenTelemetry and become an OTel ninja, check out this free, 6-episode, OpenTelemetry Bootcamp (vendor-neutral).
This is your OpenTelemetry playbook where you will learn everything, from the very basics all the way to running OTel in production. Including how to manage cost, sampling, messaging systems, and much more.
Episode 1: OpenTelemetry Fundamentals
Episode 2: Integrate Your Code (logs, metrics, and traces)
Episode 3: Deploy to Production + Collector
Episode 4: Sampling and Dealing with High Volumes
Episode 5: Custom Instrumentation
Episode 6: Testing with OpenTelemetry